For event organisers · Capacity & crowd planning

How many people are on site at three o'clock Saturday? Know the number.

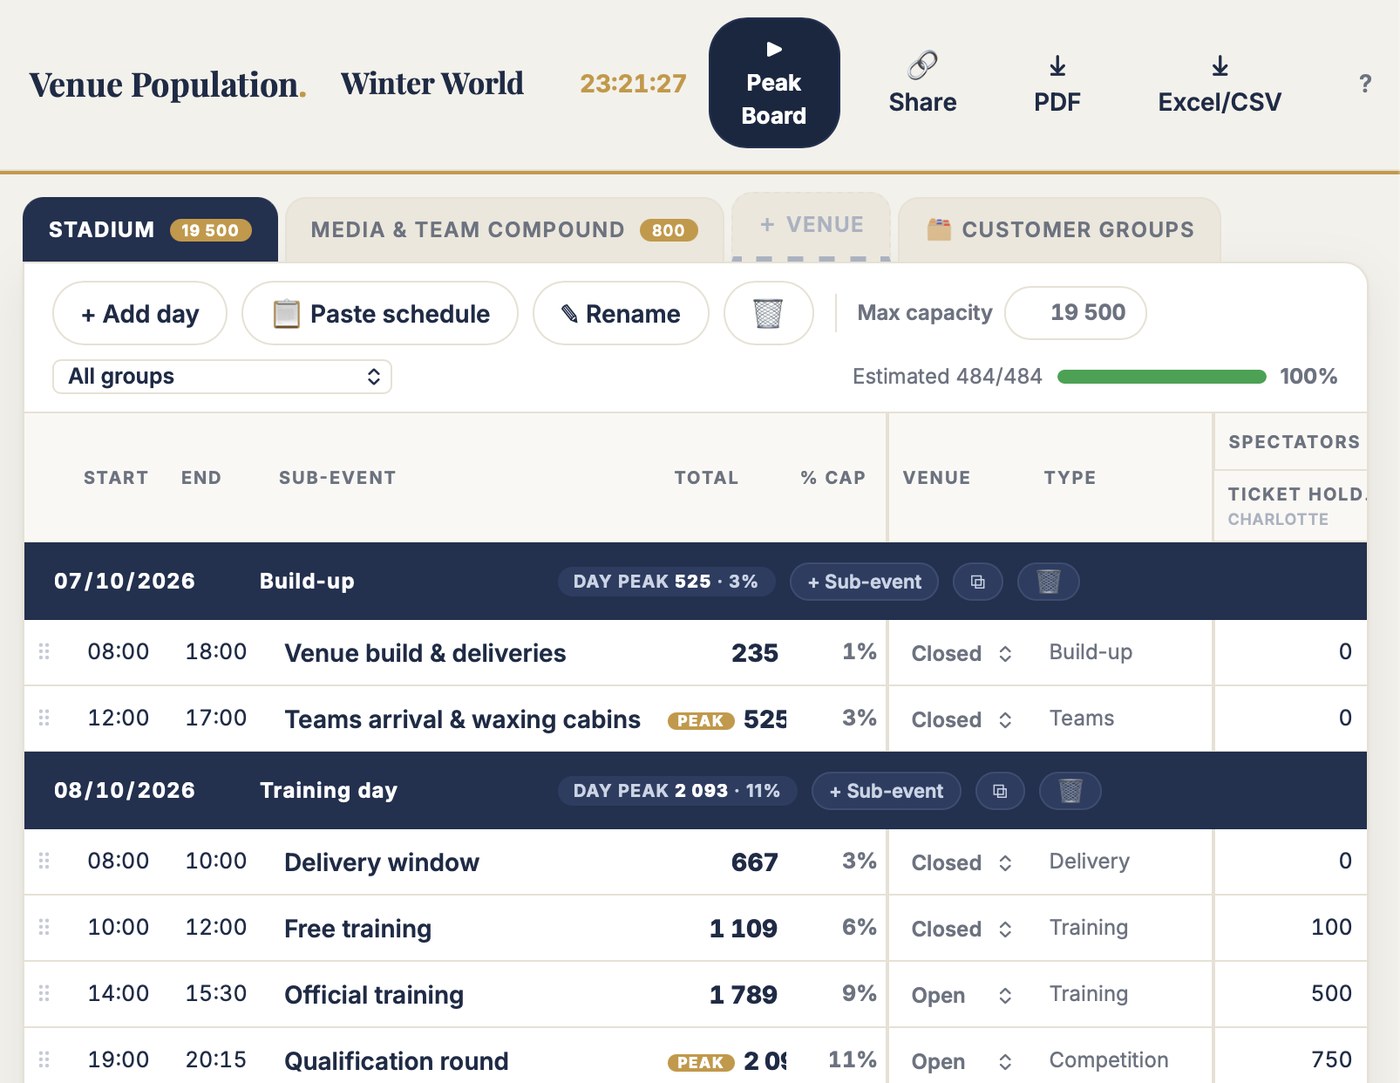
Venue Population estimates how many people are at your venue during every sub-event, and who they are: spectators, teams, media, broadcasting, staff. Your customer groups become the columns, every row totals itself, % of capacity is computed live and the peak is flagged. Security dimensions gates with it, catering counts mouths, the city reads it before signing the permit.

The one number the safety meeting needs stops hiding in column AG. That is the whole product.

Built from real models / 25+ years of event workWorld championships, World Cups, city events
Stadium crowd during an event
Every function asks the same question: how many, and when?
Three things it does

Three jobs. Nothing else.

01

Groups become columns

Define a customer group once — spectators, teams, media, staff — and it becomes a column on every venue sheet, automatically. No second file drifting a version behind, no copy-paste between the group list and the model.

02

The math can't break

Row totals, group subtotals and % of capacity are computed. There is no formula to overtype, stretch too far, or quietly sum the team columns into the Media total — the bug that hid in row 5 because nobody dared touch it.

03

Peaks flag themselves

Every day's biggest row carries the PEAK tag. At 90% of capacity the number turns gold; over 100% it turns red. The number the security meeting actually needs is the one that shows itself.

Don't take my word for it. Break the demo.

The free test is the full tool on a real example: a four-day World Cup weekend, two venues, five customer groups, every number in place. Change a headcount and watch the totals, the % and the peak move. Press ▶ Peak Board and see the capacity bars.

No account. No email. Nothing saves. Two minutes tells you more than this page can.

Excel vs Venue Population

The same six jobs. Side by side.

The jobYour spreadsheetVenue Population
The customer groupsLive in a separate file — v1.3, v1.6, backup_31052026 — and the model still uses last year's list.Defined once; every sub-group becomes a column on every venue sheet, always current.
A group totalThe Media total was =SUM(L5:V5) — quietly summing the team columns too. Nobody caught it; nobody dared touch row 5.Subtotals computed from the group definition. It cannot include the wrong columns.
A sub-group like "1.1."Excel filed it as the 1st of January. "3.8" became the 3rd of August — in the sellable template too.Read as text. "1.1." stays "1.1." on every sheet.
The peakSomewhere in 349 columns was the only number that mattered — the peak. Good luck finding it.Flagged on every day: gold at 90%, red over capacity. It finds you.
Trusting a rowEvery row's grand total is a slightly different formula. Row 7 skips five groups; row 9 doesn't.Every row totals the same way. Trust all of them in the safety meeting.
Whose number is thisConfidence in column S reads "arvaus" — a guess — with no owner and no source.Every group carries a data owner, a source and a confidence level, guess to confirmed.
You know this file

The model grew to 349 columns. The groups lived in a second file.

  • You typed sub-group 1.1. — Excel filed it as the 1st of January. Sub-group 3.8 is now the 3rd of August. In the sellable template, too.
  • The Media total was =SUM(L5:V5) — quietly summing the team columns as well. Nobody caught it, because nobody dared touch row 5.
  • Every row's grand total is a slightly different formula. Row 7 skips five groups; row 9 doesn't. Which rows do you trust in the safety meeting?
  • The customer groups live in a separate file — v1.3, v1.6, backup_31052026 — and the population model still uses last year's list.
  • Start and end estimates for every group, every row: by year three the file was 349 columns wide. Somewhere in there was the only number that mattered — the peak.

These are not invented examples. They are from models that ran World Cup weekends and a world championship. The logic was right for ten years — days, sub-events, groups, capacity. Two files fought us for ten years. Venue Population keeps the logic and loses the fight.

📄 VOP-1.4. Venue Population model 2026.xlsx
📄 2027VenuePopulationModel_ver1.xlsx — title inside: "2025 MAIN EVENT"
📄 backup_1.3. Customer Groups_31052026.xlsx
Columns in the 2026 model349
Sub-group "1.1." after Excel autocorrect1 January
Media total formula=SUM(L5:V5) — includes the teams
Assumptions sheet references#REF!
Level of confidence, column S"arvaus" — a guess
Who it is for

Built for the person who owns the capacity number.

Venue Population is for the planner whose crowd figures every other function depends on — security dimensioning gates, catering counting mouths, the city reading it before the permit — and who has to stand behind the peak in the safety meeting.

This is for you if

  • You run events where capacity and crowd figures drive permits, security and services
  • You keep a population model and a separate customer-group file that never quite agree
  • You need the peak and % of capacity per sub-event, per venue, without hunting columns
  • You want security, catering and the authority reading the same owned numbers

This is not for you if

  • You need live turnstile counts on event day. This is a planning model, not a people counter
  • You need multi-user simultaneous editing today — one owner edits, everyone else views live
  • Your 349-column model has never hidden the peak from you. Then keep it. You are the exception
What is included

Two old templates. One tool.

The Customer Group Matrix and the Venue Population Sheet — the pair that always drifted apart in Excel — merged into one mini app. The 🗂 Customer groups tab is the master list: main groups and sub-groups, owners, sources, confidence. Every sub-group automatically becomes a column on every venue sheet.

Rows are your days and sub-events: delivery window, training, gates open, competition, ceremony. Type the headcounts; the totals, subtotals and % of capacity compute themselves. One tab per venue, each with its own capacity.

  • Unlimited events, venues, days and customer groups
  • Groups flow into columns automatically
  • Totals, subtotals and % of capacity computed on every row
  • Peaks flagged; gold at 90%, red over capacity
  • One tab per venue, each with its own max capacity
  • Group library: structures from real events, one click
  • Data owners and confidence per group
  • Peak Board with A4 capacity report · view-only share links
  • A3 sheet PDF · wide Excel/CSV export
  • Runs in the browser — laptop, tablet, phone. Nothing to install
  • All updates to the current version included
Stadium · max 19 500 Estimated 100% ▶ Peak Board
Total% capSpectatorsFOHTeamsBOH
TimeSub-eventTicketsVIPΣAthletesΣ
SAT 21.3. · COMPETITION DAY 1 DAY PEAK 19 599 · 101%
10:30–11:45Gates open2 60413%1 000501 250160551
11:45–13:00Sprint qualification6 01131%3 0001003 700160561
13:15–14:00Team sprint13 81971%10 00015011 200160561
14:15–16:05Sprint finalsPEAK19 599101%16 50025018 150100496
16:05–17:30Prize ceremony & egress11 29358%9 0001509 95080355
Also included

The Peak Board: capacity, on one screen.

Full-screen view for the safety and security meeting: every sub-event as a bar against venue capacity, the 90% line in gold, the capacity line in red, the peak flagged. Front of house and back of house split at the top — because security cares who is inside the fence, not just how many.

Below the bars: who is on site at the peak, group by group. Pick a venue, pick a day, or show the whole event. Print it as an A4 capacity report for the authorities, or send a view-only link that opens straight into the board.

Peak Board. Stadium · Sat 21.3. 14:37:02
Max capacity 19 500 EVENT PEAK 19 599 · 101% FOH 18 150 BOH 1 449
SAT 21.3. · COMPETITION DAY 1
10:30–11:45Gates open2 604 · 13%
11:45–13:00Sprint qualification6 011 · 31%
13:15–14:00Team sprint13 819 · 71%
14:15–16:05Sprint finalsPEAK19 599 · 101%
16:05–17:30Prize ceremony & egress11 293 · 58%
Jesse Kiuru
Proof

An event director built this. Not a software company.

I'm Jesse Kiuru. I help event organisers and host cities bid, plan and run better events. Event director of the Lahti 2017 FIS Nordic World Ski Championships. Currently structuring the Winter World Masters Games 2028.

Venue Population exists because I kept this model for World Cup weekends and a world championship. By its third season it was 349 columns wide, the customer groups lived in a second file always one version behind, and the Media total quietly summed the team columns. The logic was right for ten years; the files fought us for ten years. The examples on this page are from my own files.

270,000spectators, Lahti 2017
3,000workforce coordinated
25+ yrschampionships to conferences
Price

€99. Once. That's it.

One peak read wrong dimensions the gates, the toilets and the transport wrong — and the city notices in the permit review. Getting that number right once is worth far more than €99. Test first — buy when it earns its place.

Venue Population · Full version
€99 one time · no subscription
  • Unlimited events, venues, days and customer groups
  • Groups flow into columns automatically — add-ons welcome
  • Totals, subtotals and % of capacity computed on every row
  • Peaks flagged; gold at 90%, red over capacity
  • Group library: structures from real events, one click
  • Data owners and confidence per group
  • Peak Board with A4 capacity report · view-only share links
  • A3 sheet PDF · wide Excel/CSV export · all updates included
Get Venue Population · €99 → or test it free first — no account, 2 minutes

Pairs with Daily Runsheet: the runsheet says when you're open, the population model says how many people are inside. Nine tools in the toolbox — any three for €199.

Questions

Asked before buying.

Can't I just build this in Excel?

You can. I did — until it was 349 columns wide, the customer groups lived in a second file always a version behind, and the Media total quietly summed the team columns. The logic was right; two files fought us for ten years. If yours never hides the peak, keep it. This is for everyone else.

Do I need to install anything?

No. Venue Population runs in the browser — laptop, tablet or phone. Your events save automatically to your account.

Where do the population numbers come from?

From you and your functions — ticketing data, entry lists, accreditation, the volunteer rota, partner sales. The tool doesn't invent numbers; it makes your estimates visible, owned and comparable. Every group carries its data owner, source and confidence level, so the safety meeting knows which numbers are ticketing data and which are still a guess.

How accurate is a venue population model?

As accurate as its sources — it's a planning estimate, not a people counter. That's the point: you dimension gates, catering, toilets and transport months before anyone can be counted. The confidence column tells you where the soft spots are. If you need live turnstile counts on event day, that's a different tool.

How is this different from Daily Runsheet?

Same rows, different question. The runsheet answers "when are we open, and when do we need to be there." The population model answers "how many people are inside while we are." Daily Runsheet times the operations; Venue Population counts the people. Serious events run both.

What does "free test" mean exactly?

The full tool on an example event — a four-day World Cup weekend with two venues and every estimate in place. Change a headcount and watch the totals, the % and the peak move. Nothing saves — 100 people can test at once and never see each other's changes.
How many people are on site at three o'clock on Saturday?
Know the number.

Two minutes in the demo tells you more than this page can.