For event organisers · Risk management

"What are our top five risks right now?" You show them.

Set probability and impact — the score, the band, the colour and the 5×5 heat map compute themselves. Owners and review dates flag themselves when they go stale. The steering meeting opens with the Risk Board: a picture, in thirty seconds, not a sideways scroll and a silence.

The register stays awake between meetings instead of sleeping in a drawer until something goes wrong. That is the whole product.

Built from real risk registers / 25+ years of event workOlympic venues, world championships, city events
Crowd at a live event in the evening
Every calm event day is a risk register that did its job.
Three things it does

Three jobs. Nothing else.

01

It scores itself

Set probability and impact 1–5; the score, the band and the colour follow — on the same scale every year. No dragged formula quietly pointing at the wrong row, no total that looks plausible and is wrong.

02

It draws the top five for you

The 5×5 heat map redraws itself from the register in real time. When the steering group asks what your biggest exposures are, the answer is the Risk Board on screen — not a silence and a sideways scroll.

03

It nags before it goes stale

Every risk carries an owner, a plan and a review date. Passed dates turn red and count on the board. The register asks for attention instead of waiting silently until something happens.

Don't take my word for it. Break the demo.

The free test is the full tool on a real example event. Score a risk and watch the heat map move. Open the Risk Board and read the whole picture in one screen. Toggle between inherent and after-mitigation risk.

No account. No email. Nothing saves. Two minutes tells you more than this page can.

Excel vs Risk Register

The same six jobs. Side by side.

The jobYour spreadsheetRisk Register
The score=M6*N6+O21 — a dragged formula quietly referencing the wrong row. The total looks plausible. It's wrong.Probability × impact, computed. There is no formula to drag, so it cannot point at the wrong row.
The top fiveThe steering group asks "what are our top risks right now?" The answer is silence and a sideways scroll.A live 5×5 heat map and a ranked board. Top five on screen in seconds.
The scaleScored 1–3 in one year's file, 1–5 in the next. Your own registers don't agree with each other.The same 1–5 scale every event, every year. Comparable by design.
Owners and reviewsNames in the owner column, but no review dates. Whether any mitigation happened, nobody knows.Owner, plan and review date per risk. Passed dates turn red; the coverage bar shows what has a plan.
Keeping it alive35 columns. Filling it feels like an audit, so it happens once and never again.A library of 22 classic event risks to start from, and a board that makes staying current cheap.
The copy for the authorityAn emailed workbook, dated in its own filename, already out of date.A view-only link or an A4 report — always the current register.
You know this file

Written in a serious mood, filed with the authorities, never opened again.

  • The score column holds a dragged formula that quietly references the wrong row. The total looks plausible. It's wrong. I found one in a register of mine.
  • 35 columns of x-marks. Filling it feels like an audit, so it happens once — in master planning — and never again.
  • The steering group asks "what are our top five risks right now?" The answer is silence and a sideways scroll.
  • Probability was scored 1–3 in one year's file and 1–5 in the next. Your own registers don't agree with each other.
  • There are names in the owner column — but no review dates. Whether any mitigation actually happened, nobody knows.

These are not invented examples — I found the wrong-row formula in a register of mine. The structure was right the whole time: risks, probability, impact, owner, response. The spreadsheet just let it fall asleep. Risk Register keeps the structure and gives it an engine.

A file you may recognise

RISK_REGISTER_19012016.xlsx
KindExcel workbook · 35 columns
CreatedFor the permit application
Last modifiedThe date in its own filename
Cell O6=M6*N6+O21

Made once. Filed. Forgotten. The next time it opens is after something went wrong.

Who it is for

Built for the person who answers to the steering group for risk.

Risk Register is for the organiser or safety lead who owns the register the authority demands and the board reviews — and who is asked, in the room, what could go wrong and what's being done about it.

This is for you if

  • You run events that need a risk register for permits, insurers or a steering group
  • Your register gets written once in master planning and never opened again
  • You want the top exposures on one screen, not scattered across 35 columns
  • You need the authority and the board to see the current register without emailing workbooks

This is not for you if

  • You need an enterprise GRC platform with audit trails and compliance workflows. This is the working event register, not a corporate system
  • You need multi-user simultaneous editing today — one owner edits, everyone else views live
  • Your Excel register has never gone stale in a drawer. Then keep it. You are the exception
What is included

A risk register with an engine.

List what can go wrong, group it by theme, set probability and impact 1–5 — every risk gets its score, its band and its place on the heat map. Owners, responses, mitigation actions and review dates turn the list into a plan, and the coverage bar shows how much of the register actually has one.

Runs in the browser. Nothing to install. A library of classic event risks — power, network, weather, no-shows — means you start from experience, not a blank page. The structure follows registers used from Olympic winter venues to the Lahti 2017 World Championships.

  • Unlimited events and registers
  • Auto-scoring: probability × impact, bands and colours
  • Live 5×5 heat map and the Risk Board meeting view
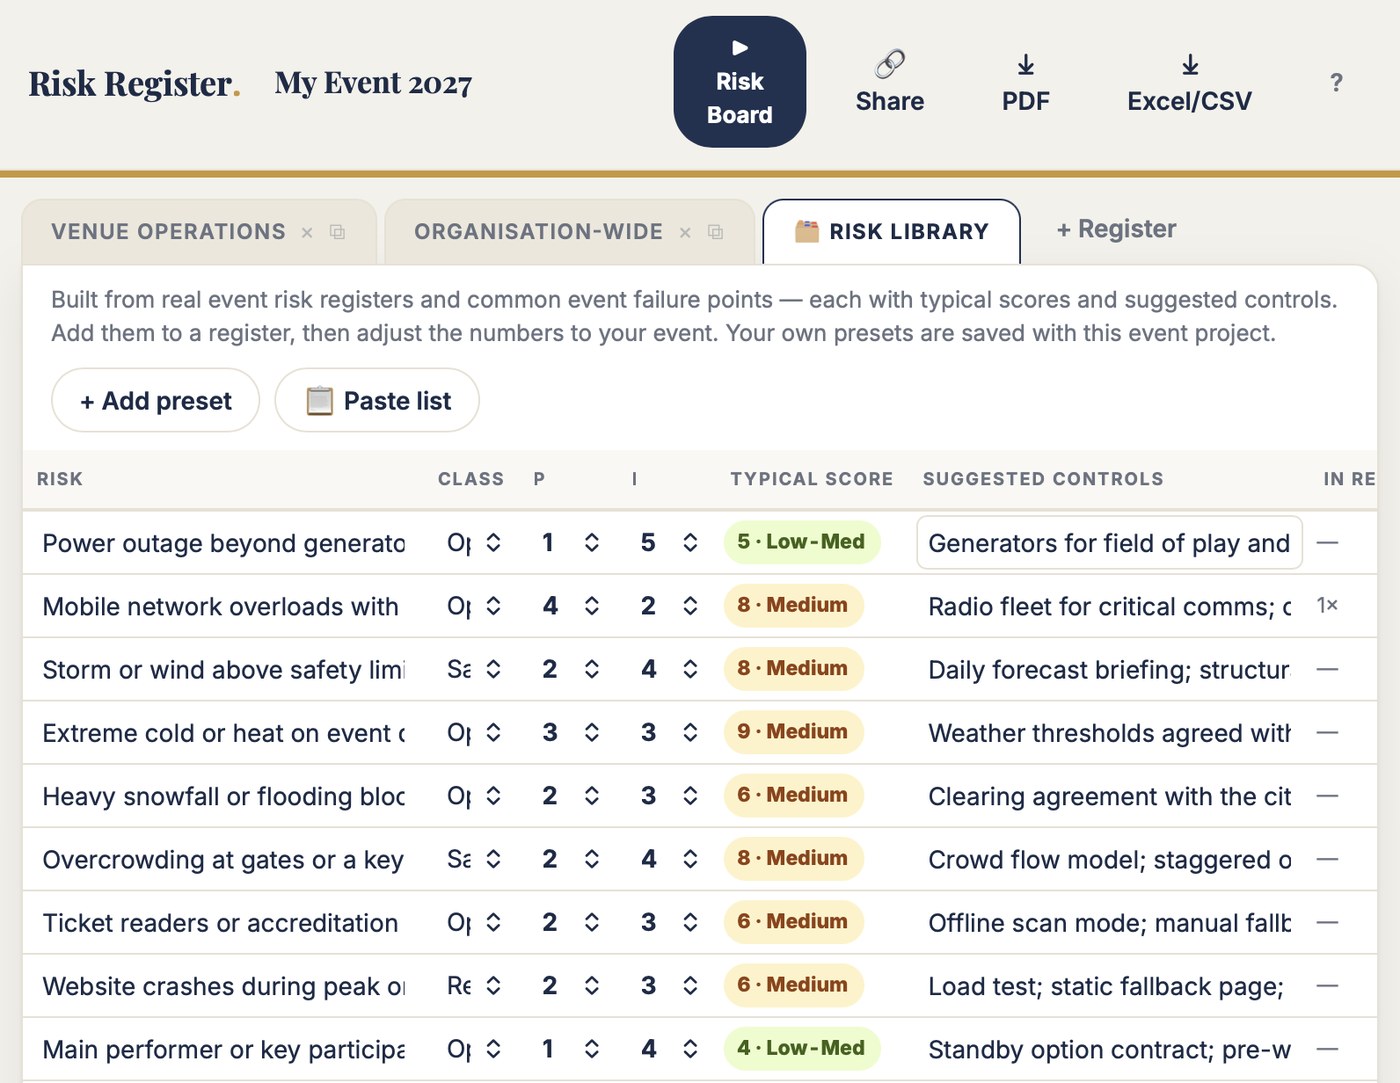
  • Risk library: 22 classic event risks with suggested controls
  • Owners, responses, review dates with overdue flags
  • Residual scoring — before and after mitigation
  • Coverage bar — how much of the register has a plan
  • View-only share links · A4 risk report · A3 register PDF · Excel export
  • Paste-list import from your existing sheet
  • Runs in the browser — laptop, tablet, phone. Nothing to install
  • All updates to the current version included
Covered 9/13 · 69%▶ RISK BOARD
#RiskAreaPIScoreOwnerStatus
WEATHER & NATURE3 RISKS
R-01Storm wind above safety limits at the stageSite248 · MediumSafety OfficerIn progress
R-02Colder than −20 °C on event daysOperations339 · MediumOps ChiefNot started
TECHNOLOGY & POWER4 RISKS
R-04Power outage beyond generator coverageTechnical155 · Low-MedTechnical ChiefIn progress
R-05Mobile network overloads with full crowdIT4312 · HighIT ManagerIn place
Also included

Risk Board: the view that opens the steering meeting.

Full screen. The live heat map, the top exposures, coverage and overdue counts. Toggle between inherent risk and after-mitigation. Print it as an A4 report for the board and the authorities.

This is the picture people actually want from risk work. A 35-column spreadsheet can't give it — which is why the question always lands on you instead.

Risks 17Extreme 1High 3Covered 71%⚠ Reviews overdue 2
1
1
1
2
3
2
1
2
1
1
1
1
R-11Overcrowding at the main gate at opening20
R-05Mobile network overloads with full crowd12
R-02Colder than −20 °C on event days9
Jesse Kiuru walking through an event hall during build-up
Proof

An event director built this. Not a software company.

I'm Jesse Kiuru. I help event organisers and host cities bid, plan and run better events. Event director of the Lahti 2017 FIS Nordic World Ski Championships. Currently structuring the Winter World Masters Games 2028.

Risk Register exists because I have written the same register before every major event since the 2000s — and watched it fall asleep in a drawer every time. The structure in this tool is the one that survived those events; the engine is what Excel never gave it. The examples on this page are from my own files.

270,000spectators, Lahti 2017
3,000workforce coordinated
25+ yrschampionships to conferences
Price

€99. Once. That's it.

Risk management platforms are sold to enterprises as yearly subscriptions. One risk caught awake instead of asleep pays for this many times over. Test first — buy when it earns its place.

Risk Register · Full version
€99 one time · no subscription
  • Unlimited events and registers
  • Auto-scoring: probability × impact, bands and colours
  • Live 5×5 heat map and the Risk Board meeting view
  • Risk library: 22 classic event risks with suggested controls
  • Owners, responses, review dates with overdue flags
  • Residual scoring — before and after mitigation
  • View-only share links · A4 risk report · A3 register PDF · Excel export
  • All updates to the current version included
Get Risk Register · €99 → or test it free first — no account, 2 minutes

Pairs with Contingency Planner: the register scores what could go wrong, the planner writes what you do when it does. Nine tools in the toolbox — any three for €199.

Questions

Asked before buying.

Can't I just build this in Excel?

You can. I did, before every major event since the 2000s — and watched it fall asleep in a drawer every time, with a dragged formula quietly pointing at the wrong row. The structure was right; the engine was missing. If your register never goes stale, keep it. This is for everyone else.

Do I need to install anything?

No. Risk Register runs in the browser — laptop, tablet or phone. Your events save automatically to your account.

Does the steering group or the authority need accounts?

No. You send a view-only link — the register, or the Risk Board directly. Or you print the A4 report. Nobody on their side installs or registers anything.

I already have a risk register in Excel. Do I start over?

No. 📋 Paste list takes your risks one per line — statement, area, probability, impact — and builds the register in minutes. Old sheet in, living register out.

How do I know the scores are "right"?

You don't — risk scores are judgements, not measurements. The tool's job is to make your judgement visible, consistent and comparable: the same 1–5 scales every year, argued openly at the table instead of hidden in a formula.

What does "free test" mean exactly?

The full tool on an example event. Score risks, open the Risk Board, print the report, share links. Nothing saves — 100 people can test at once and never see each other's changes.

The permit will demand a register anyway.
Build one that stays alive.

Two minutes in the demo tells you more than this page can.